When Data IS the product

Increasingly, apps of all kinds are attempting to count things,show graphs, and estimate future. Smitten by AI and the most amazing hope of attempting to use our history to affect the future - truly noble goal. However, there are wide ranging considerations that should be given to products that “use data” vs products that are really “about the data”
For exmaple, consider an app helpiung you post social media apps - at the right time to optimize your reach vs designing Tableau. First consider the difference in user base. Tableau is a great example of trying to make many people feel like a “data-rock-star” however the social media post optimizer will always have a wider audience.
Overview
Was thinking about libraries in the context of business principals.
Not too far from a Barnes & Noble store retailer.
If we replace the books with data - or frankly just call the books an instance of data. We can ask ourselves what do libraries (or bookstores) teach us about products where data is the product.
But Wikipedia is a similar thing right?
There are many levels to consider when dealing with massive amounts of disparate data
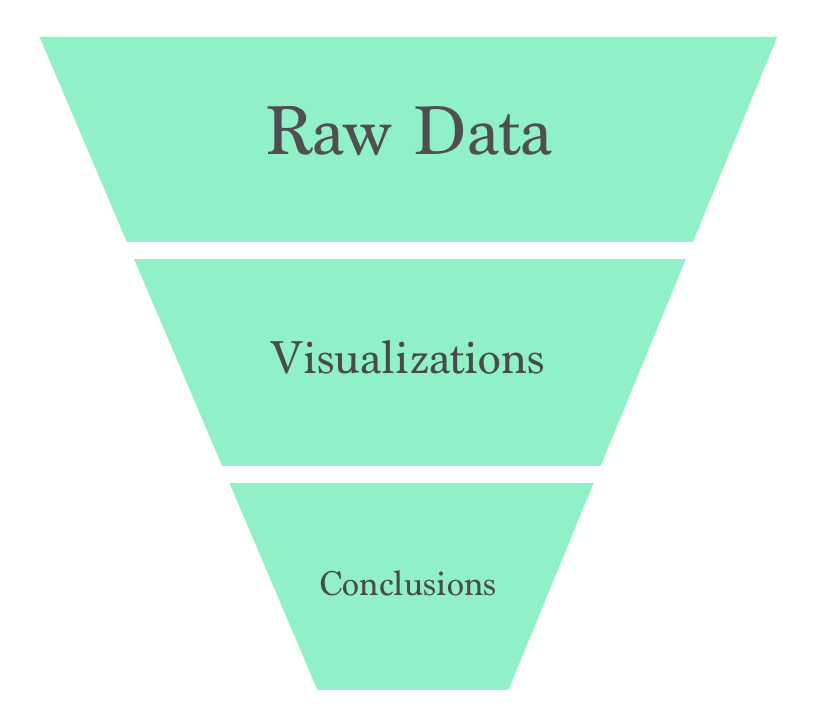
Raw Data
- MetaData
- set in stone = Author, publish date, etc
- InStock and Store Location
- How to access it and if your accessing the data causes restrictions on others
- DataSets can be checked out
- Ask Refining Questions
- Presents increasing levels of description detail
- a shallow static layer of description (Title, Author, etc)
- Libraries tend to have a small, deeper level of description (think the back cover)
- And then Amazon has pioneered a preview read
- Lastly, there is the option to check it out or buy (or even rent)
- Editorialized Cleansed Datasets
- represent the set of transform rules
- represent as a shallow copy (diffs from the original)
- represent as a deep copy (yikes)
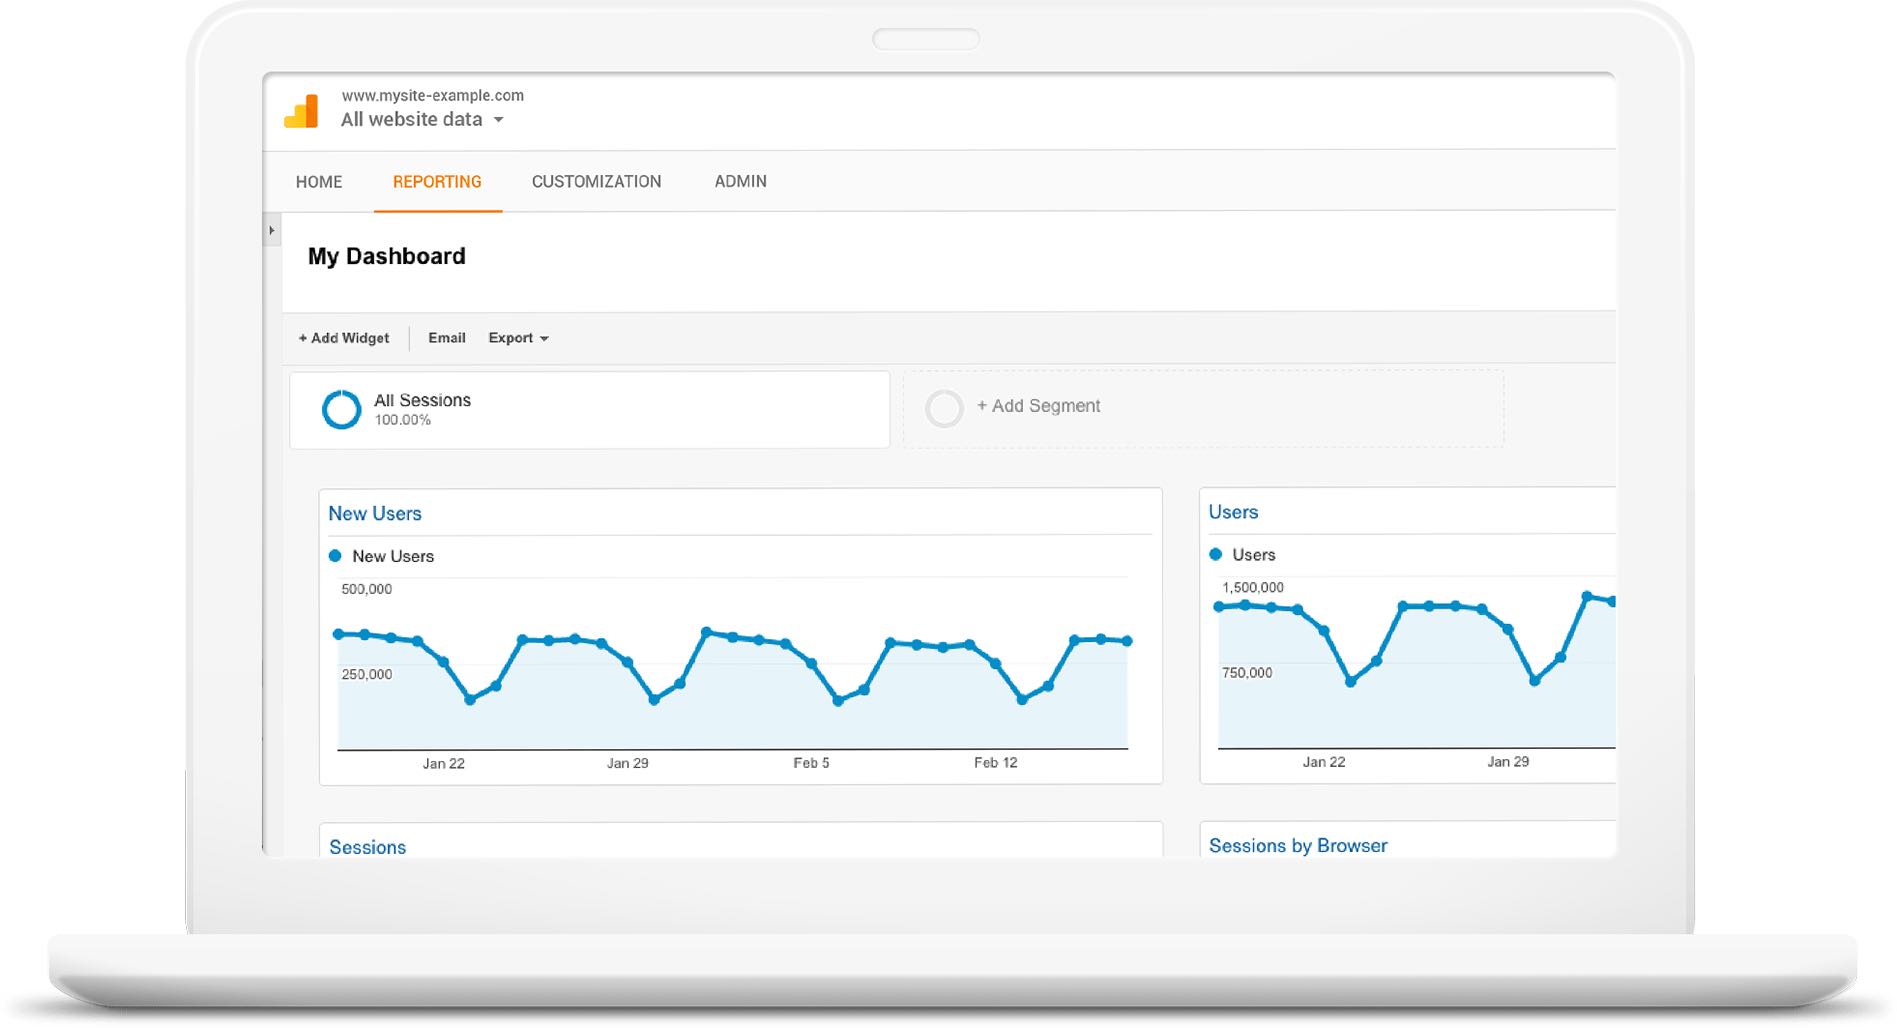
Data Visualizations
One level of abstraction away from the raw data is a visualization.
Visualizations are a preferred method of consuming large data sets because the human brain is capable of abstract thinking. Allowing the designer to encode data in various visual dimensions.
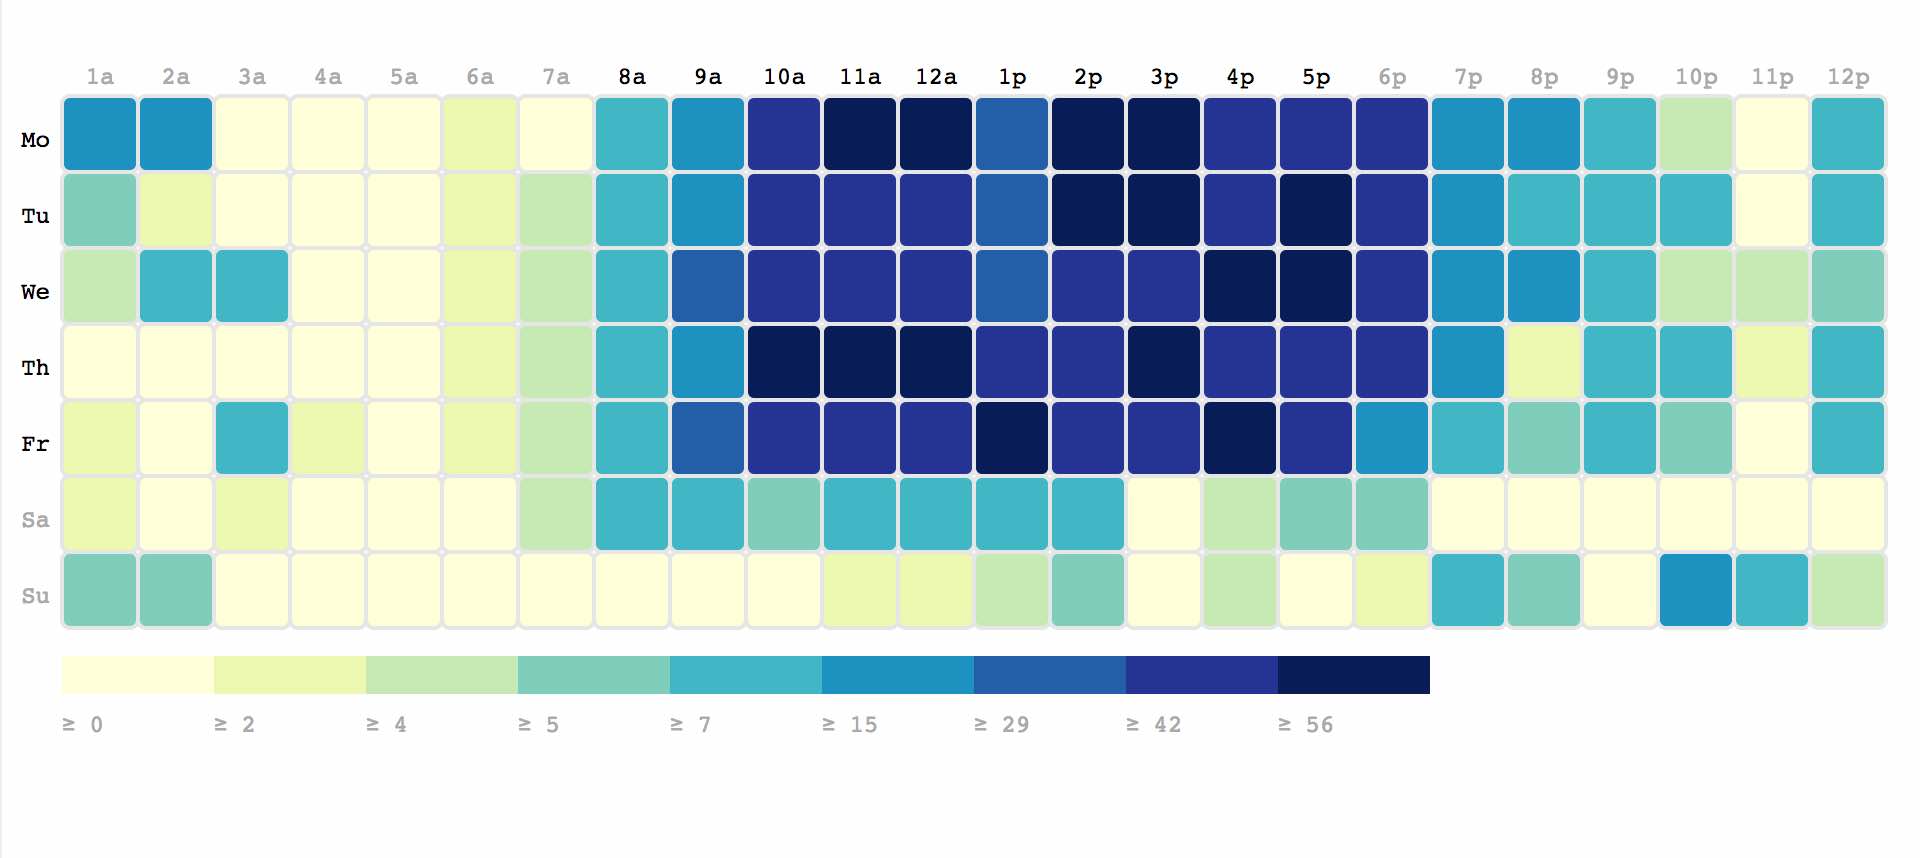
Consider a Buble Chart where X = GDP, Y = Child Mortality Rate, Buble Size = Country Size, Buble Color starts as very transparent and gets more solid as we approach modern time
Tufte Principles…
Data Driven Conclusions
Conclusions are the densest way of transporting change from the data.
Conclusions may be solely based on your data - it may be cross-referenced, correlated, and filtered by external datasets to create an answer or more importantly a summarized story. Often things that analysts hear as answers are only interesting because there was intrinsic curiosity about the topic latent in the organization - a story was generating about “will Moose and Squirrel survive”? - which created fertile ground for planting the seed of a conclusion. People latch on to those nuggets for better of for worse.
When wielding conclusions make sure that your conclusion fits the story that makes it palpable. Because a great answer to the wrong situation leads to frustration and confusion in the long term.